Complex data sets and computational models are the foundation of many research efforts and engineering applications. However, these models often generate results that are too large, abstract, or intricate to be easily understood. At Ignition Computing, We specialize in transforming raw data into meaningful insights. Whether you need to identify trends, understand complex relationships, or communicate findings effectively, we'll work closely with you to create visualizations that drive your projects forward.
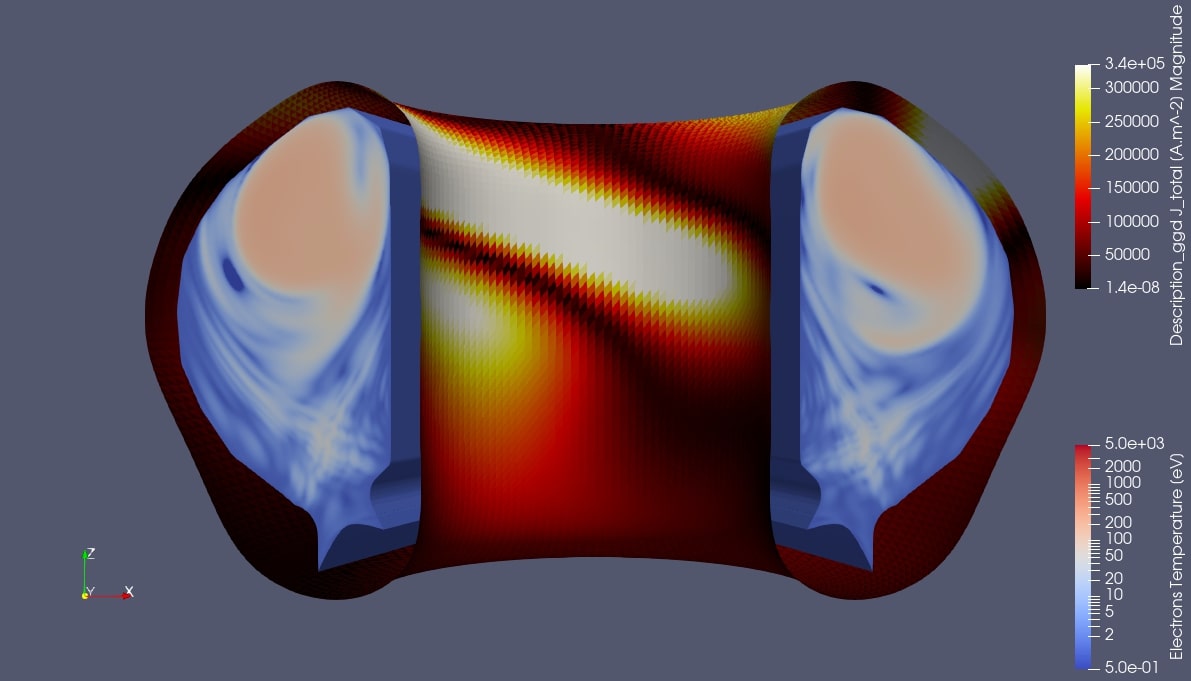
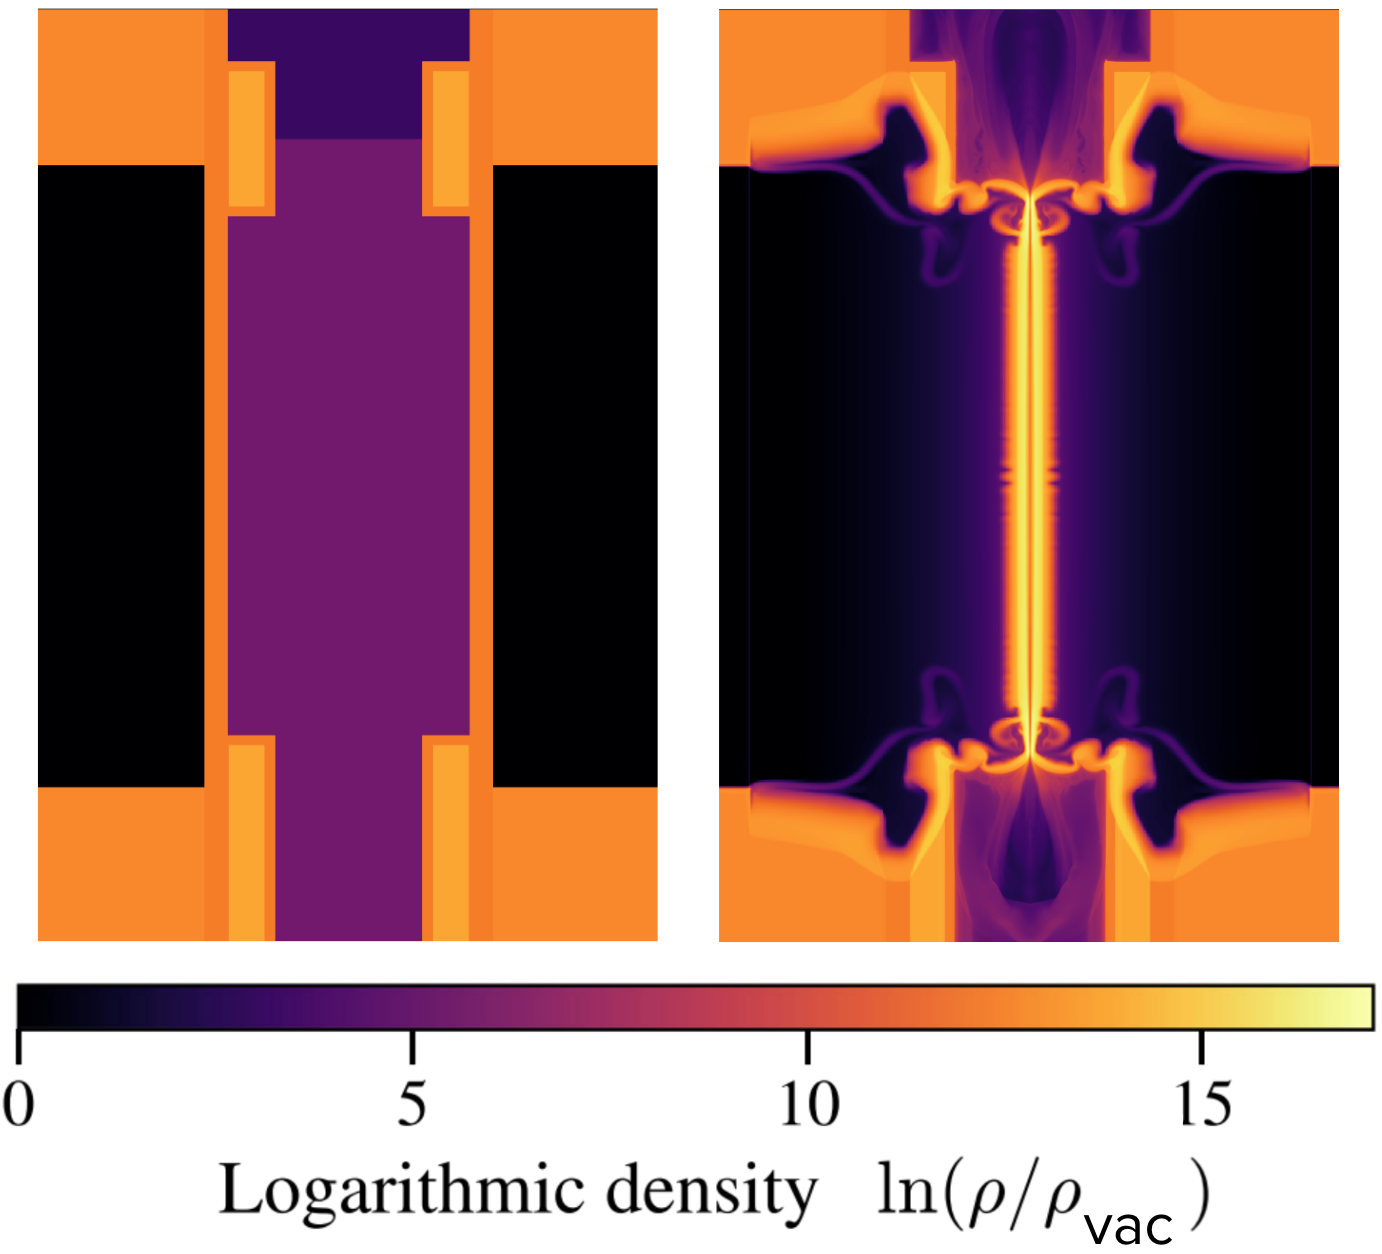
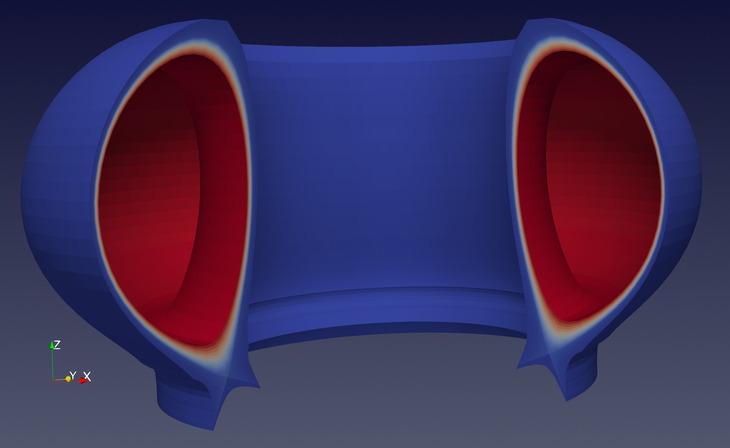
We have built visualisation tools for scientific research, processing terabytes of data into two- or three-dimensional graphics and animations. Whether you need (automated) graphics generation in Python, MATLAB, C, Fortran or on the web, we have you covered. Or how about VTK, 3D animations and ray-tracing?
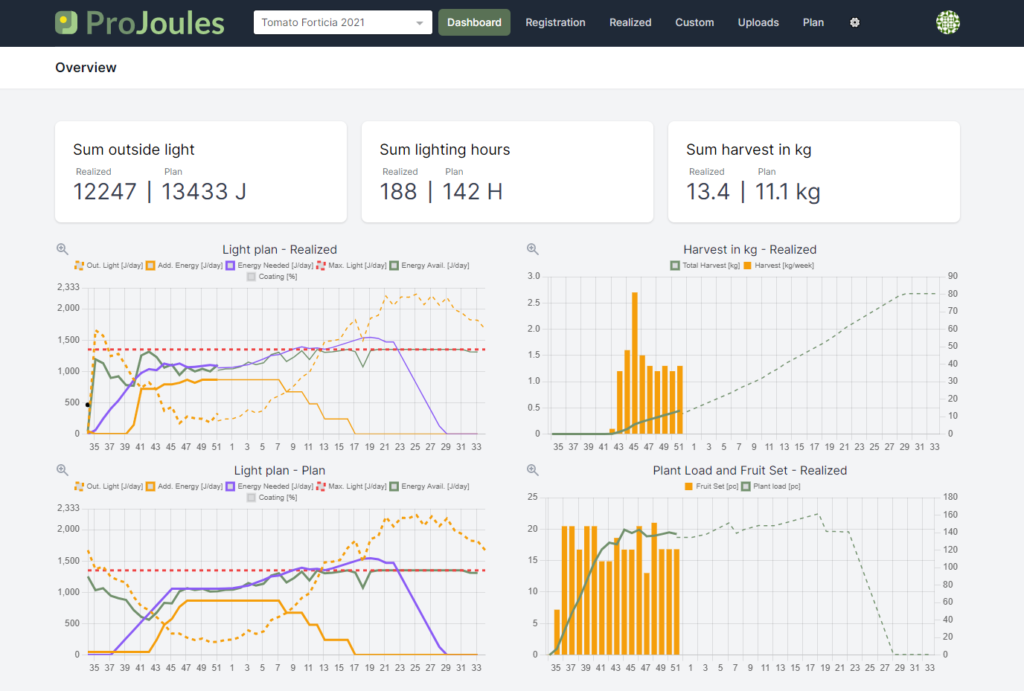
Visualizing data through web-pages or mobile apps can make it easier to share and analyze the data in a collaborative business or research setting. We bring strong experience with building physiscs-based model applications for pc, tablet and mobile users. Our team has done projects with in Ruby on Rails, Javascript, among other software frameworks and langauges.